Hi everyone!
Today’s blog is about a dataset that I’m using for my research here at Western, as one of the participating activities we’re doing for this year’s Planetary Seminar course! I thought quite a lot about which tool I should write about for this exercise, and in the midst of the hectic schedule of the impact cratering field course I’m on (I’ll talk about this in more details once I’m back home), I ultimately decided to write a bit about the dataset that’s not only one of the very essential part of the work I’ve been doing, but also something that’s very new to me. And so without further ado, let’s dive right into it!
So for those who aren’t aware, my work here at the University of Western Ontario with Dr. Catherine Neish entails looking at lunar impact craters with these unique, radar-dark haloes surrounding them using multiwavelength (S-band, P-band) imagery from radar instruments such as the LRO Mini-RF, Earth-based radar as well as other instruments like the Microwave Radiometer (MRM) of China’s Chang’E2 orbiter and the LRO Diviner radiometer. With a comparative analysis of these multiwavelength datasets, we’re trying to understand the mechanism behind these radar-dark haloes. Today, I’d like to talk a bit about the microwave radiometer and how I plan on using its data.
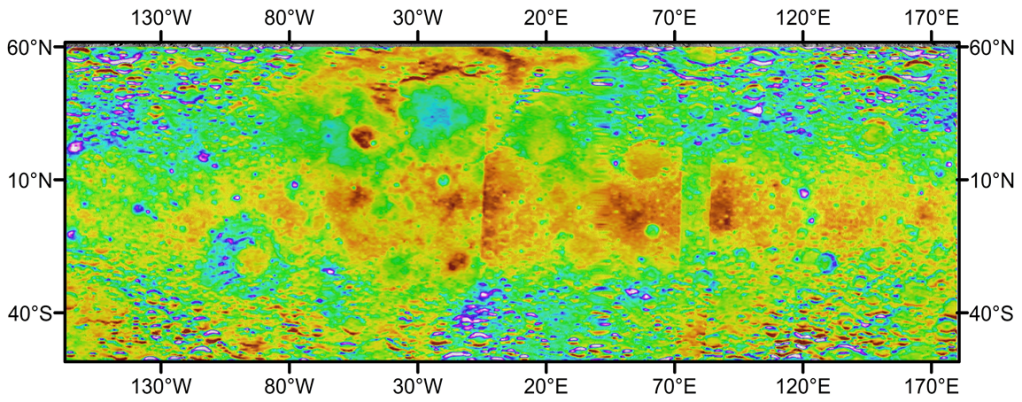
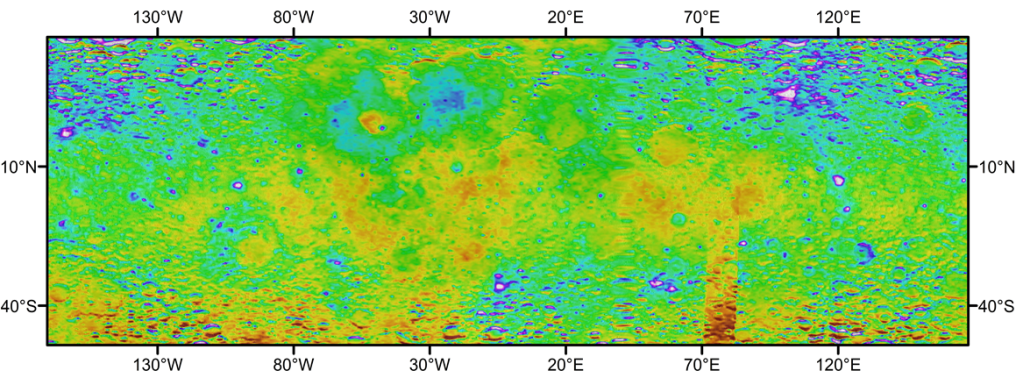
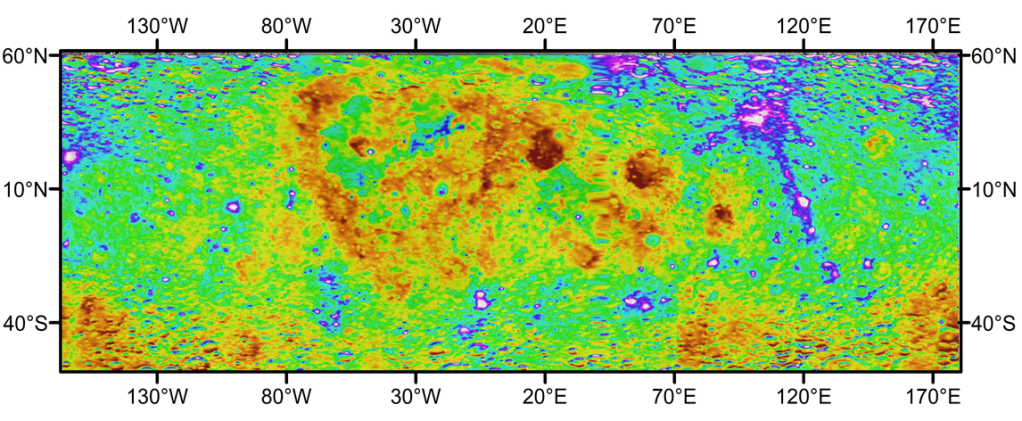
So, China’s Chang’E spacecraft have provided us with variety of datasets, many of which are quite unique measurements not made by other spacecrafts. One such dataset is the microwave radiometer carried by the orbiters Chang’E-1 and 2 (CE-1, CE-2). The main objective of the MRM is to sense passive thermal emissions from the lunar surface and subsurface. There are four operative frequency bands: 3, 7.8, 19.35 and 37 GHz, each of which has their own unique penetration depth. While this MRM data, especially the higher-resolution data from the CE-2, haven’t been much utilized in geological analysis of the Moon, it has been quite helpful in a number of studies regarding the regolith properties such as the dielectric constant, regolith thickness and 3He abundance. The way I utilize this instrument in my work is by analyzing previously calibrated (by Dr. Yong-Chun Zheng), global maps of brightness temperatures (TB) for the lunar day and night in each of these four bands (see the figures below). The brightness temperature is basically a measure of the radiance emitted by the surface and is related to the physical temperature and dielectric properties of the emitting surface. As I mentioned before, because each of the wavelengths have different penetration depth, by a collective analysis of brightness temperature maps of each band, we can see some really interesting local and regional structure at varying depths. Even in these maps below, you can see how different the lunar surface and near subsurface looks in different bands as the microwave emissions are collected from different penetration depths.

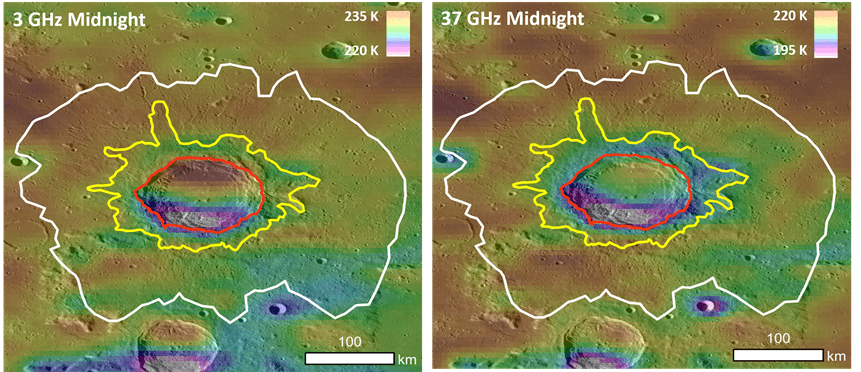
In previous works, people have compared the MRM brightness temperatures with the Diviner nighttime temperature data. The temperature anomalies noticed in the MRM maps often differ from anomalies seen in the LRO Diviner nighttime temperature maps. The reason behind this difference is that the infrared emissions of Diviner come from the surface while the MRM microwave emissions originate from differing depths beneath the lunar surface. To elaborate, rocks on the lunar surface which have comparatively higher thermal inertia compared to the porous lunar regolith, remain warmer than their surroundings throughout the night. This gives us higher surface temperatures for these regions in the diviner nighttime maps. The Microwave radiation on the other hand penetrates to greater depth than the IR and is thus more influenced by subsurface temperatures. Moreover, rocks are less transparent to microwave radiation than soil. And so, if for instance, there’s a rock-rich layer in the near subsurface, it will suppress the passive microwave emissions and will record lower brightness temperatures. And so, to put it simply, the regions that appear ‘hot’ in the diviner data might appear ‘cold’ in the MRM data! In my work, what we’ve noticed so far for these radar-dark halo craters is that the halo regions seem to have slightly warmer brightness temperature than the continuous ejecta blanket right outside the crater rim. This suggests that in the halo region, there is an increased escape of microwave emissions from a greater depth (probably from a rock-rich layer, which is overlain by a meter thick, rock-poor, fluffy regolith layer).
Aside from creating a great opportunity to compare surface infrared emissions with the subsurface microwave emissions, this MRM data is also quite compatible with the existing radar datasets. For example, band-I (10 cm) and band II (3.8 cm) of the MRM are quite compatible with the Mini-RF and Earth-based radar wavelengths (S- and X-band respectively). And so, in my work, I compare the radar backscatter from the Earth-based and Mini-RF radars to the passive radiometry from MRM to characterize the physical properties of the surface and subsurface at these dark halo regions at varying depths.
So far, I’ve observed a couple of radar-dark halo craters using this MRM data and compared the results with a crater without such an apparent dark-halo (i.e. Tycho). What we’ve observed so far is a lack of any obvious difference in the regolith characteristics of these craters and their surrounding region at surface and near subsurface level. Our observations at this point are insufficient to make any certain claims about the mechanism of these dark haloes. We need to gather more data from other radar-dark halo craters and compare them with ‘normal’ craters (preferably from various geological ages) to identify and explain any general trends.
Until next time!

